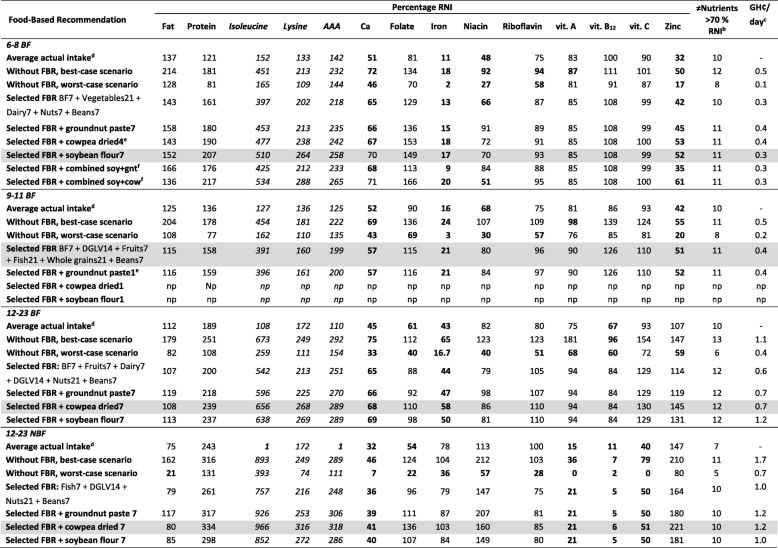
- 6-8 BF = breastfed children of 6-8 months, 9-11 BF = breastfed children of 9-11 months, 12-23 BF = breastfed children of 12-23 months, 12-23 NBF = non-breastfed children of 12-23 months, BF7 = average breastmilk 7 times per week (every day), DGLV = dark green leafy vegetables, Meat = meat, fish or egg food group, Nuts = nuts, seeds and unsweetened products sub food group, soy+gnt = soybean flour plus groundnut paste and soy+cow = soybean flour plus cowpea (tested with servings as stated above in table as individual addition). np = not possible within energy constraints
- Bold values = Values below 100% RNI for the best-case scenario and values below 70% RNI for the worst-case scenario of the modelled diets and for average actual intake
- Grey boxes = for each target group the final set of recommendations that achieved >70% of the RNI in the worst-case scenario for most nutrients but below the 75ht percentile of daily diet costaValues are expressed as percentage of recommended nutrient intakes (RNI)
- bTotal number of nutrients that are above 70% of RNI
- cTotal cost of modelled diet per day in Ghanaian Cedi’s (GH₵)
- dAverage actual intake = percentage RNI covered by average actual intake of target group
- eHighest servings per week possible within energy constraints
- fNot possible to combine all three legumes within energy constraints
